How to search
Rloop DB2 is a searchable database that provides comprehensive, user-friendly information on predicted R-loop forming sequences of eight model organisms.Retrieve RLFSs in 4 Steps
- Select your species of interest (at least one species). Human is selected as a default organism. To cancel RLFS search in human, user can click on the human icon. Multiple organisms can be selected for searching at a time.
- Select search option containing various search terms such as keywords, Ensemble IDs, and gene symbols. Enter gene keywords into the search field and click the Submit button in order to begin the search. Note: keywords search is the default search option.
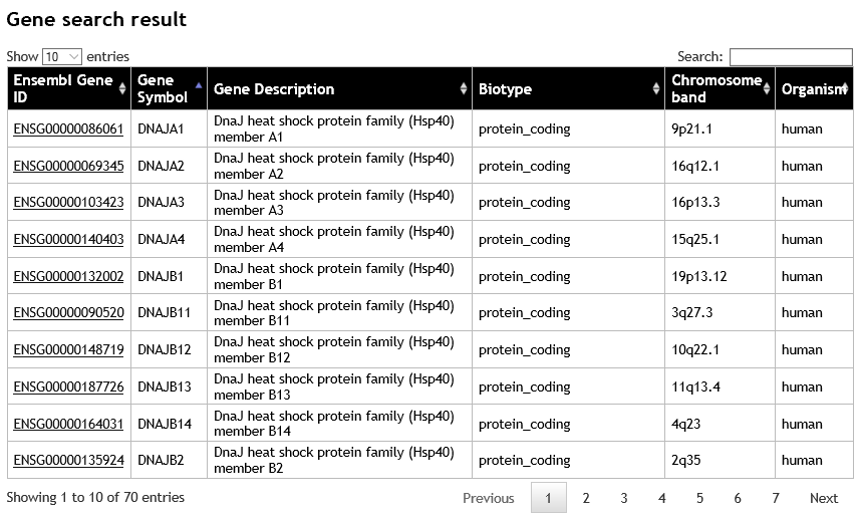
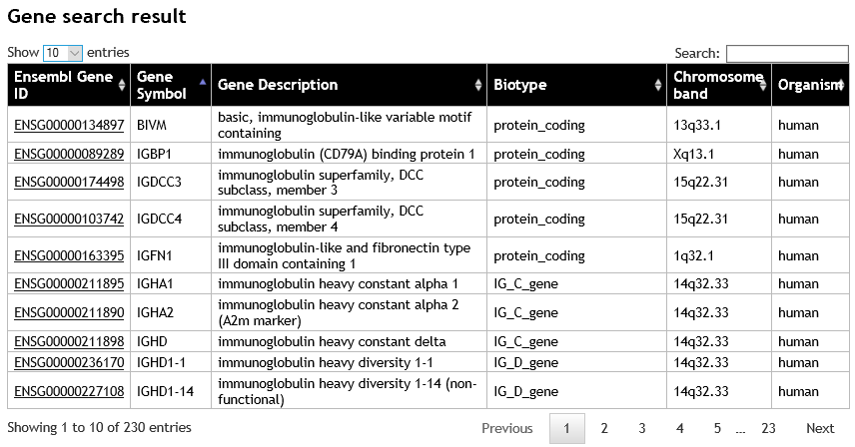
- The search result page displays a list of matched genes, showing the Ensembl ID, gene symbol, gene description, biotype, chromosome band, and organism. To display the gene, click on the Ensembl ID. The user can narrow down the gene list by adding more specific keyword or gene symbol into the search box (on the top-right corner of the table). The maximum number of search results is limited to first 1,000 matched genes.
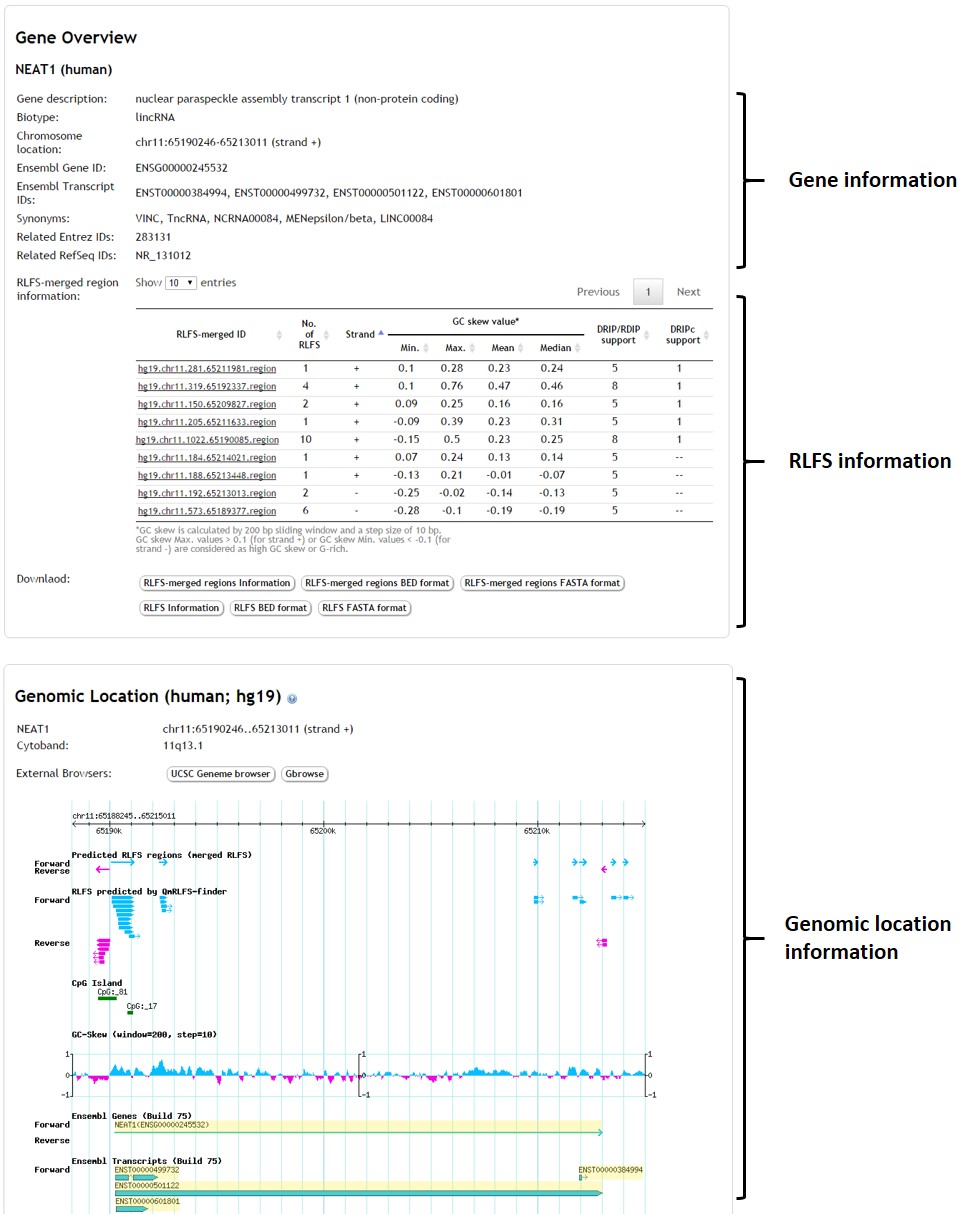
- The graphical page displays gene information, RLFS information, and graphical genome mapping of all RLFS regions and RLFSs data according to the particular gene together with genic regions. The user can click on the RLFS track for the detail of each R-loop.


Genomic visualization
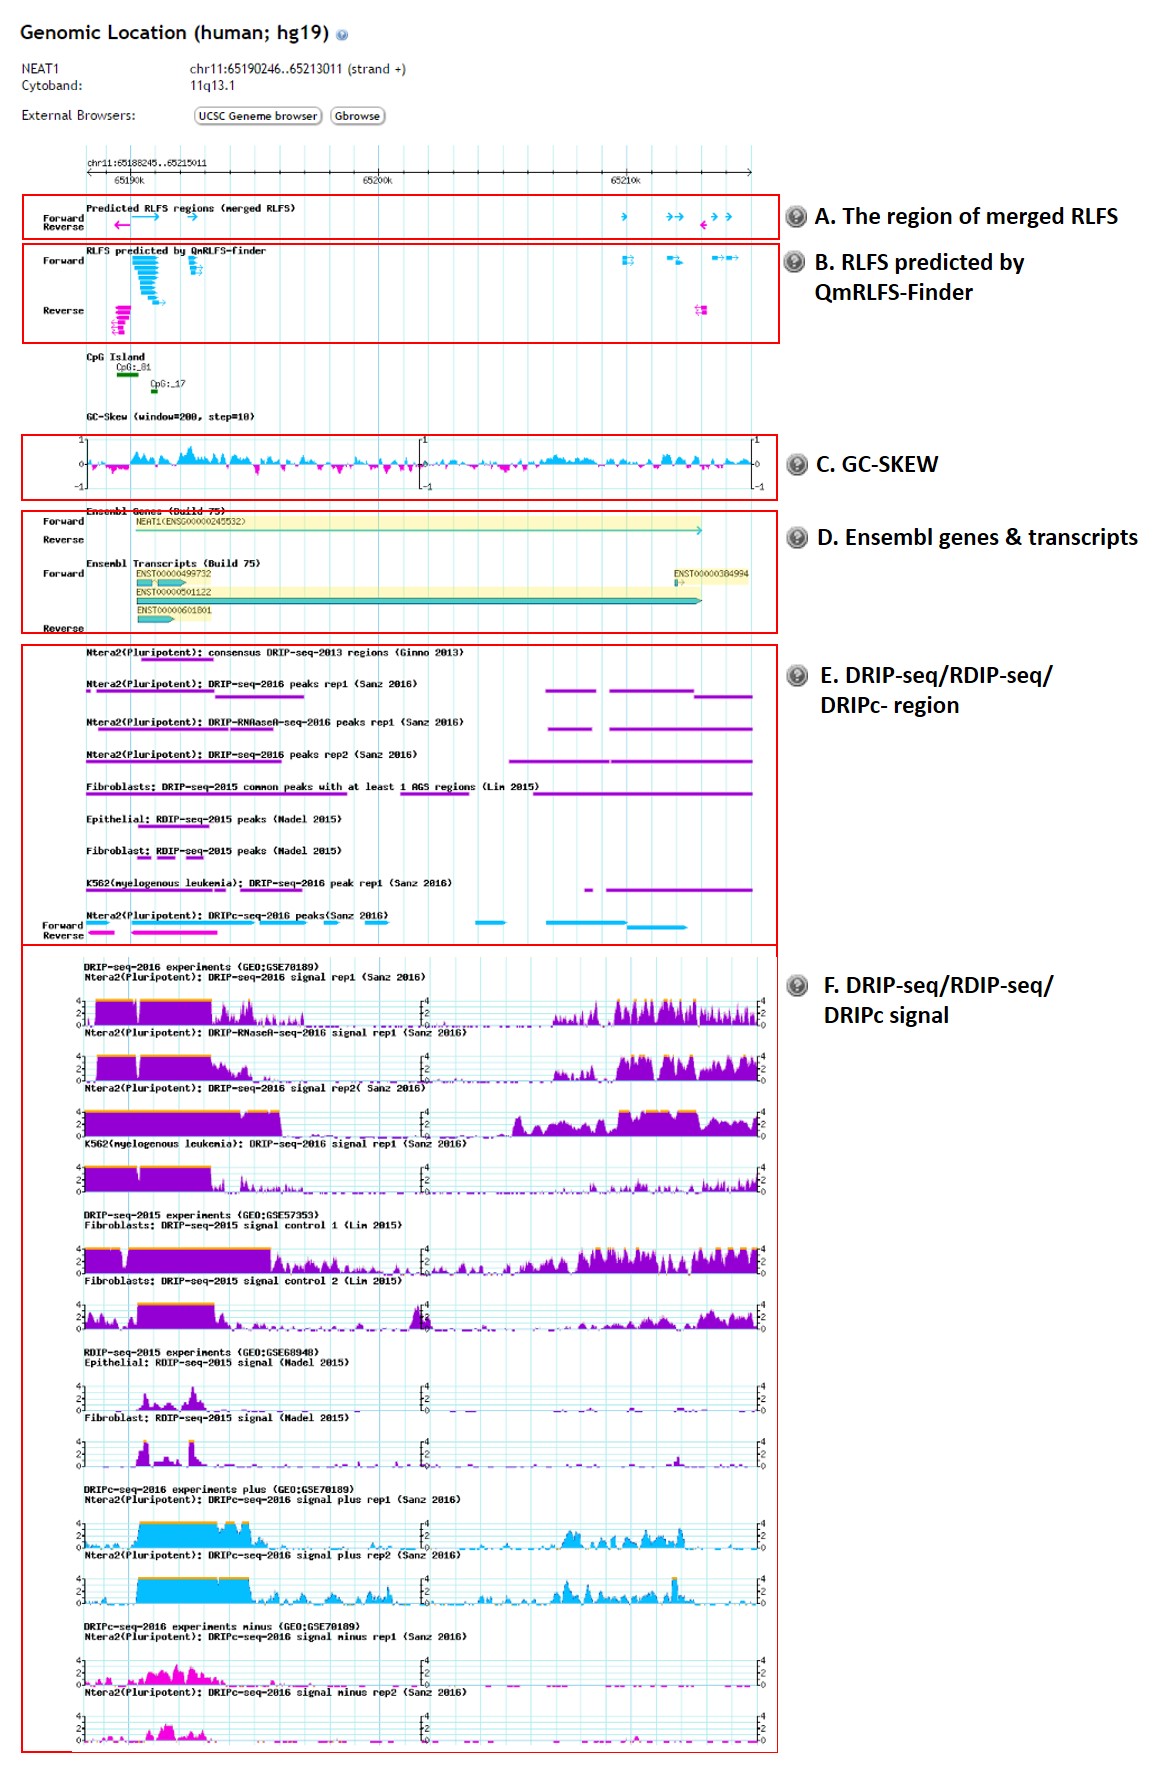
- The region of merged RLFS
- RLFS predicted by QmRLFS-Finder
- GC-SKEW value
- Ensembl genes and transcripts
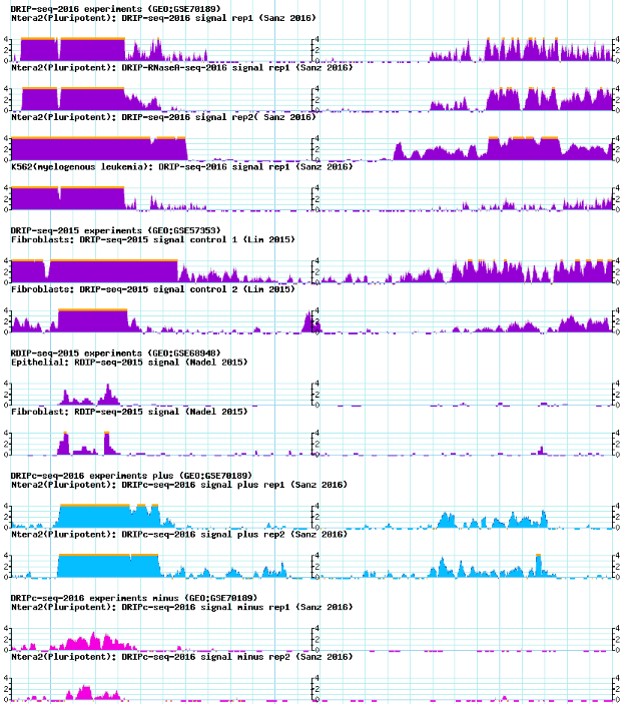
- DRIP-seq or RDIP-seq peak regions
- DRIP-seq or RDIP-seq signals
- The users can select "Keywords" and specify a search term into the submit box such as:
- Search with multiple IDs
- To search immunoglobulin gene family
- Logical search
- Multiple organisms can be selected for searching at a time.
The predicted RLFSs are merged if they have at least one nucleotide overlap. The light blue track with the arrowhead indicates the orientation of the positive-strand RLFS regions and pink track with the arrowhead indicates the orientation of the negative-strand RLFS regions.

Without merging, all possible RLFSs predicted by QmRLFS-Finder are shown in this track. The light blue track with the arrowhead indicates the orientation of the positive-strand RLFS and pink track with the arrowhead indicates the orientation of the negative-strand RLFS.

GC-skew, a key sequence determinant that favors co-transcriptional R-loop formation, was calculated using a 200 bp sliding window and a step size of 10 bp. GC-skew values ranging from -0.01 to 0.05 were considered as low GC-skew and those with GC-skew values >0.1 were considered as high GC skew (Ginno et al. 2015).

The Ensembl genes and transcripts were retrieved from Ensembl (version 75). The yellow-highlighted genes/transcripts are the genes/transcripts of interest. The direction of the genes/transcripts is indicated by an arrowhead.

Raw or processed datasets from DNA-RNA immunoprecipitation followed by sequencing (DRIP-seq) and
DNA-RNA immunoprecipitation followed by sequencing (RDIP-seq)
experiments from three different studies (Ginno et al. 2013,
Lim et al. 2015, Nadel et al. 2015, and Sanz et al. 2016
)
are downloaded from the Gene Expression Omnibus (GEO; http://www.ncbi.nlm.nih.gov/geo).
To get the DRIP-seq signal, briefly, sequencing reads were mapped to the hg19
reference genome. Peak calling was performed using MACS to get DRIP-seq peaks and DRIP-seq signals.
DRIP signal were assigned back to restriction fragments and consensus DRIP-seq peaks were called.
We use processed data of DRIP-seq and RDIP-seq when the data are available.
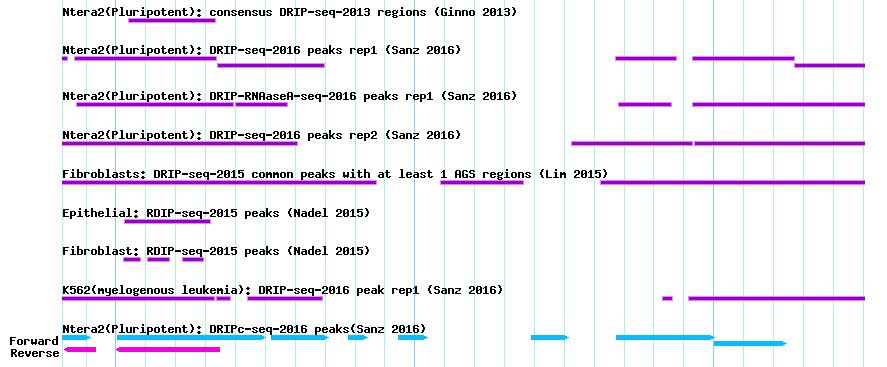
The figure below shows DRIP-seq and RDIP-seq peak regions which were derived from strong DRIP-seq signals.
The figure below show DRIP-seq and RDIP-seq signals for each dataset.

Advance searching
The user can search "Keywords" with multiple IDs simultaneously.


The user can select "Keywords" option and put immunoglobulin or immunoglo* to the submit box

To search heat shock protein but not include pseudogene, user can put "heat shock protein" -pseudogene to the submit box

